
A gut-picked lottery number and a backtested one look identical once they hit the ticket. The only real difference is what happened before the numbers got there. One came from whatever felt lucky that morning, the other survived weeks of arguing with a spreadsheet (a spreadsheet my wife has opinions about, none of them flattering). I've built my whole approach to Powerball strategy — really, to lottery data analysis and AI tool testing in general — around that gap, treating spreadsheet management less like a hobby and more like due diligence on tools that promise more than random chance can deliver.
Coworkers pulled me into this originally through an office Powerball pool that ran on birthdays and anniversaries — my numbers included, for the first year, before I split off and started tracking things separately. Nobody in that pool ever hit more than a couple of numbers on any given draw, and neither did I, which is exactly the point: a birthday-based pick carries no more information than a coin flip. It just feels like it does, because the numbers mean something to you personally.
Instinct Picks vs. a Backtested Sheet
That's the baseline I hold every AI lottery predictor tool against now. Powerball draws from a pool of 69 white balls and 26 red balls, with roughly a 1-in-292,201,338 shot at the jackpot combination. Numbers large enough that any tool claiming an edge on the jackpot itself is making a promise it can't back up. Where a tool can actually be tested is further down the payout ladder: does the set of numbers it hands you, tracked over enough draws, land more hits than a random set would.
What Does Backtesting Actually Mean for AI Tool Testing?
Three different platforms I tested this way all leaned on some version of a neural network — Long Short-Term Memory (LSTM) models, specifically, trained on historical draw sequences. Backtesting, in the plain sense I use it, means logging each tool's predicted numbers before a draw happens and checking them against the real result afterward, not once, but across enough draws that a lucky guess doesn't get mistaken for a working method.
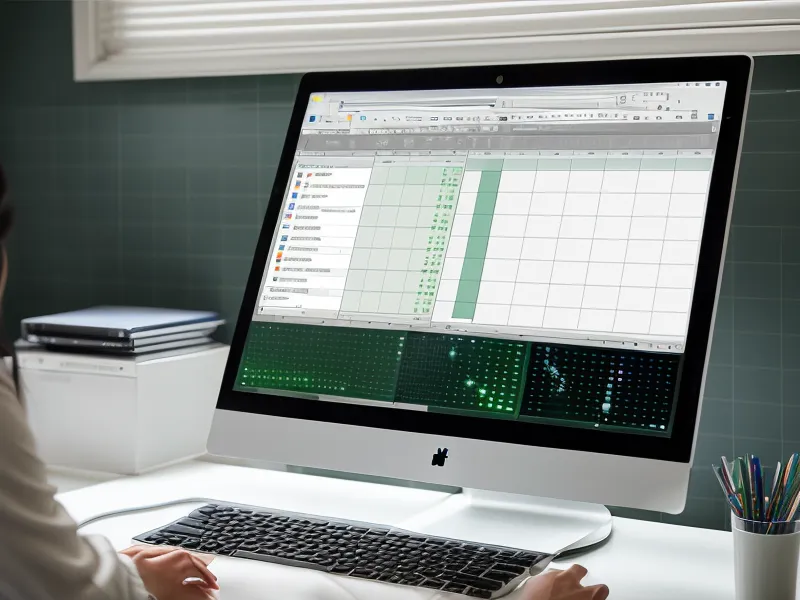
I built the sheet around three tabs: one where I paste each platform's suggested sets before the draw, one that pulls the official winning numbers once they're posted, and a third that runs a VLOOKUP between the two and spits out a hit count. Next to every AI-suggested set sits a randomly generated control set, built with a plain Excel formula, so each prediction gets measured against chance itself, not just against silence.
Draw-frequency counts by themselves didn't do much better. I ran a stretch of the sheet that only tracked how often each number had come up historically, no AI tool involved, and it performed about the same as the birthday pool had — which tells you the AI wasn't adding much if all it was doing was frequency counting with extra steps. The hot-and-cold number idea shows up in a lot of these tools' marketing pages, and logging results is the only way to tell whether leaning on it helps or just feels like it should.
The early version of this setup is written up in more detail in the spreadsheet that annoyed my wife, including the exact formulas behind the hit-count tab. What's changed since then is less about the mechanics and more about what I bother tracking: fewer jackpot fantasies, more attention to whether a tool's picks cluster around numbers a human would pick anyway.
Running the Comparison Every Draw Night
Every Powerball draw — Monday, Wednesday, and Saturday — gets logged the same way: predicted sets in, actual numbers in, hit count calculated, control set compared. Jarrod Pittman, the coworker who talked me into the original office pool, still gets updates on this whether he asks for them or not. Over lunch one week at a sandwich place near NoDa that Jarrod likes, I pulled up a predicted set next to that draw's actual numbers and found three of them lined up. For a second it felt like I'd found something real.
Jarrod, who's seen enough of these updates to know better, pointed out that three matches out of five white balls happens by chance often enough on its own that it doesn't prove the tool did anything — and checking the longer run of the sheet backed him up. That's the sort of gut-check a raw hit-rate number can't give you by itself; you need someone or something forcing you to ask whether a result is signal or noise before you get excited about it.
The sheet spits out a hit-rate percentage automatically for every logged set, though the finer mechanics of verifying picks against drawn numbers is a big enough topic that it deserves its own write-up rather than a paragraph here. Some players skip AI predictions entirely and instead try to optimize how they use quick picks (a rabbit hole in its own right), leaning on the randomness the terminal already generates rather than trusting a model's suggestion — a different approach I haven't run through this sheet.
The Two Methods Diverge on Confidence, Not Numbers

This sheet, run across three different AI tools, tells a fairly plain story on raw hit rate: the AI-suggested sets and my random control group land white-ball matches at roughly the same clip. I lay out the fuller numbers behind that in six-month spreadsheet obsession, but the short version holds up here too — neither method is meaningfully better at guessing the actual drawn numbers, and any tool claiming otherwise is selling something. Where the AI-suggested sets pull ahead, slightly, is in avoiding the exact combinations a birthday-based pool gravitates toward: sequences, round numbers, anything that reads like a calendar date.
That's a real, if modest, advantage — not because the AI is smarter about which numbers will be drawn, but because it isn't drawn to the same numbers everyone else picks by instinct. Payout tiers below the jackpot split among however many people picked the same winning combination, so avoiding the crowd's favorite numbers doesn't change your odds of winning, but it can change what you keep if you do. The birthday method has zero defense against that; a spreadsheet, at least, gives you a way to check whether a tool is actually steering you away from the crowd or just repeating it back with extra confidence.
If you're playing for entertainment and don't care whether a number came from a machine-learning model or your kid's birthday, the backtesting step buys you nothing — buy the ticket and move on. If you're the type who wants to know whether a subscription-based AI tool is actually doing something beyond generating a nice-looking number grid, build the comparison sheet first and decide after a real stretch of draws, not after the tool's own dashboard tells you it's confident. Whether that spreadsheet effort beats just trusting the platform's built-in analytics outright is its own argument, and not one I'm settling in this post; neither is whether any given subscription is worth paying for, or which red flags should make you close a tool's tab before you ever hand over a card number.
What This Comparison Doesn't Cover
Wheeling systems, where you cover a set of numbers across multiple partial tickets, never made it into this sheet at all — that's a coverage math problem separate from prediction, and I haven't tracked it. Mega Millions runs a different matrix than Powerball entirely, which is part of why I've kept this sheet Powerball-only rather than mixing games with different odds into one comparison. The random control set is the piece that makes any of this worth reading rather than just a log of numbers, though the deeper case for why a random baseline matters more than people assume is worth more space than I'm giving it here. A reader named Trey Moriarty checks in every few months to ask whether any of this AI-picked business is doing anything for him, and the honest answer stays about the same each time: roughly what chance would give him, with the occasional secondary-tier prize slightly less shared than average.
None of this changes the total cost of playing over time. Tickets add up the same whether the numbers came from an algorithm or a birthday, and tallying that cost ticket by ticket is a separate ledger I keep apart from the hit-rate sheet. What the comparison does settle, for me, is which method deserves any trust at all: a backtested process that gets checked against real draws, not a model's own confidence score or a set of numbers that happen to mean something personally. The spreadsheet won't turn the odds in my favor. It just stops me from mistaking a coincidence for a strategy.
The information on this site is based on personal experience and research for informational purposes only. It is not a substitute for professional medical, financial, or legal advice. Always consult a qualified professional before making decisions that affect your health or finances.