
Two AI Lottery Strategy Tools, One Spreadsheet
Lottery Defeated costs fifty dollars more than LottoChamp, and after twenty weeks of tracking both against real Powerball and Mega Millions draws, the cheaper tool is the one still open on my second monitor every week. That's the short version of this product comparison. The long version involves a lot of data analysis, one skeptical wife, and a coworker who thinks the whole exercise is pointless but keeps asking to see the results anyway.
None of what follows should be read as financial advice. I'm not a mathematician, a statistician, or anyone qualified to tell you the lottery is anything other than a bad bet with a fun wrapper. What I am is a data analyst who got curious enough to build a spreadsheet, then curious enough to keep updating it for five months straight, tracking picks from two AI lottery strategy platforms against the actual draws they claimed to predict.
How I Started Tracking Every Draw
For the first year I played, I picked numbers off family birthdays, the way half the country probably does, and I never once tracked whether it made a difference. It didn't — or at least the two small wins I remember looked exactly as random as everything else in that stretch. A coworker named Jarrod Pittman is the reason I joined the office Powerball pool in the first place; he plays every week mostly for the Friday-afternoon pool chatter, not because he thinks any of us has cracked anything. Somewhere around then I started wondering whether the numbers themselves could be read like any other dataset, the way you'd study a random number generator output looking for a flaw in the seed.
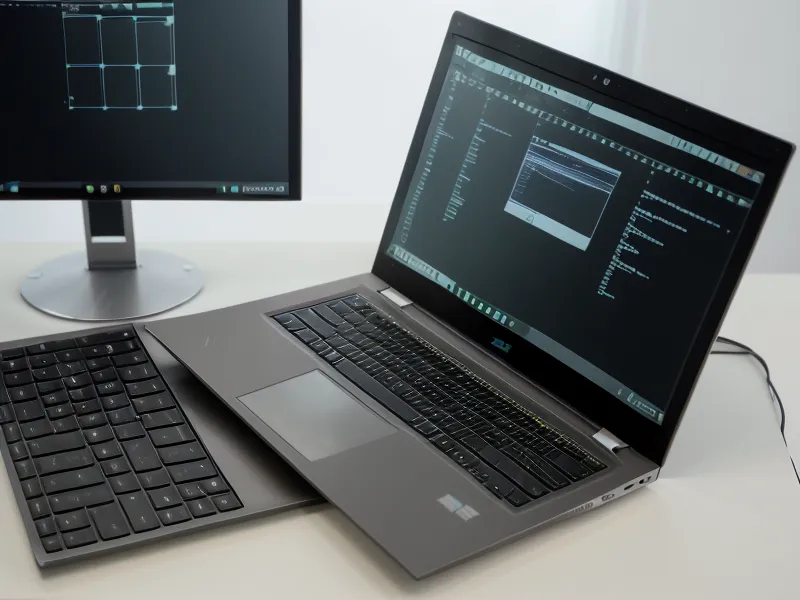
That question turned into a spreadsheet, and the spreadsheet turned into a second monitor angled so the afternoon light doesn't wash out the columns. The whiteboard behind my desk still carries last month's tally marks, half-erased, and most nights past ten the only light in the room is the monitor glow and a desk lamp, with a small calendar taped to the monitor frame just to mark which nights are Powerball and Cash draws, which probably tells you something about how far this has gone. If you want the actual mechanics of how I built the tracker, I wrote up the whole process in How to Build a Powerball Tracking Spreadsheet: A Data Analyst's Step-by-Step Guide. Once that sheet existed, testing AI tools against it was the obvious next step — draw-frequency analysis is exactly the kind of claim a spreadsheet is built to check.
Lottery Defeated Delivered Frequency Data, Not Answers
Lottery Defeated was the first tool I ran through the tracker, starting in mid-January, and it's priced around $197. Logging in feels like sitting down at a real command center, with dedicated modules for Powerball and Mega Millions, a running frequency chart, and an active user forum where people post their picks the way other people post workout screenshots. I followed its "hot" and "overdue" number logic for weeks without questioning it, mostly because the dashboard is confident enough that it's easy to forget you're looking at frequency data, not a forecast.
Eventually the data guy in me pushed back on the premise. If a number hasn't hit in ten weeks, that doesn't make it due — probability doesn't carry a memory of the last drawing, and treating "overdue" numbers as more likely is a bit like assuming a stock is due for a rally just because it's been flat for a month. The history doesn't care what you think should happen next. By the twelve-week mark, my sheet showed a small edge over pure random picks, but not enough of one to justify the entry price next to a cheaper option doing something similar. I get into that price-versus-data question directly in Is Lottery Defeated Software Worth the Price for Casual Players? if you want the full breakdown.
The Pivot To LottoChamp
In late March I shifted primary testing to LottoChamp, priced at roughly $147 — fifty dollars less, which mattered mostly because it made the head-to-head cleaner. The interface looks like it hasn't been touched since 2015, and I mean that as a neutral observation, not a knock. What held my attention was the historical database underneath, updated weekly, and the fact that it clusters numbers into sequences instead of just ranking them hot or cold. I'd already gone sour on hot-cold framing after the Lottery Defeated stretch, so a tool asking a different question felt worth the switch. I logged some of the stranger clusters it produced in My Late-Night Spreadsheet Rabbit Hole: Testing AI Pattern Recognition Against the Lottery Chaos, including a run where "Smart Picks" landed a three-number or two-plus-Powerball match about 14% more often than my random control group over the twenty-week window.
Backtesting a claim like that only means something if you check it against a baseline instead of trusting the marketing copy, and running picks across both Powerball and Mega Millions matters too — the two games have different matrices, so a tool tuned for one won't automatically behave the same way on the other. One Saturday in April, LottoChamp suggested a run of consecutive numbers that looked wrong to my eye, the kind of sequence most people avoid on purpose, and that night's draw landed a cluster of numbers in the twenties, with LottoChamp only one digit off on two of them. In data terms that's a tight variance, not a win, but it's the closest any tool got to the actual shape of a draw during the whole test.
What The Spreadsheet Actually Shows
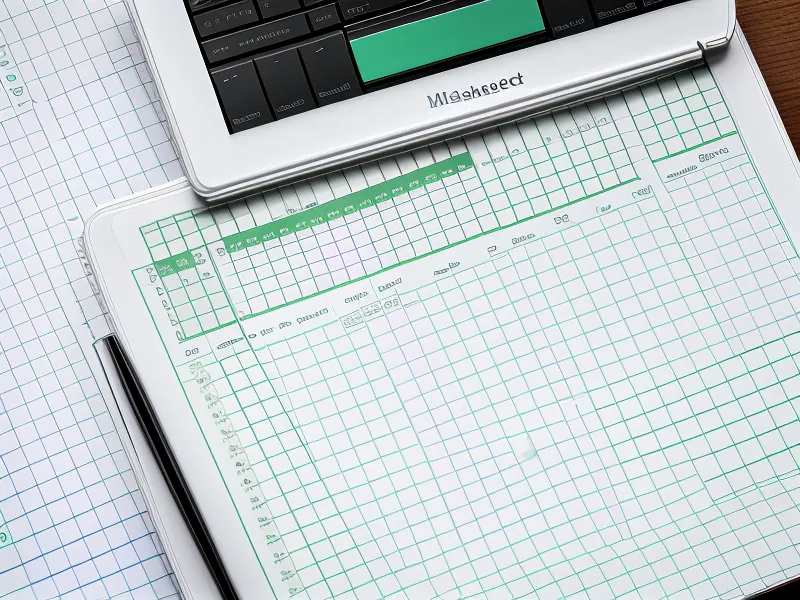
Between mid-January and late May I tracked 40 total draws across both Powerball and Mega Millions, running both tools against the same weeks. LottoChamp landed a three-number match three separate times over the twenty weeks; Lottery Defeated landed it once. LottoChamp's database also refreshed within a few hours of every single draw, while Lottery Defeated was reliable except for one stretch where the hot-number list sat stale for almost two days. On pure look and feel, Lottery Defeated wins — it's the more polished product. On raw data availability, LottoChamp wins by a wide margin, and that's the column I actually care about.
Hit-rate tracking only means something next to a control group, so I ran a plain random-pick baseline alongside both tools the entire time, and neither platform beat that baseline by enough to call it decisive — just enough to notice. Wheeling systems, the strategy of covering more number combinations at once, aren't something either tool touches, so I can't speak to that side of it from this test. And the total cost of playing didn't stop at the software price — factor in the actual ticket spend for two draws a week across five months, and the tool fee turns out to be a smaller slice of the real number than either sales page makes it sound like.
Week Four: The Fridge Note And A Reader Named Trey
Somewhere around week four of the twenty-week run, I taped that week's comparison sheet to the fridge so it wouldn't get lost under the mail, and my wife stopped on her way to the coffee maker and actually read the whole thing before saying anything (I like to think she was proofreading, not judging). She still thinks the spreadsheet is excessive. She's probably right about that. But it was the first time the tracking felt like something worth showing someone instead of a habit I was mildly embarrassed about.
A reader named Trey Moriarty emailed after my first review post to say he'd tried logging his own Powerball and NC Cash 5 numbers in a notebook and given up after a few weeks because the entries never added up to anything he could act on; he still plays both games every single draw week without exception, notebook or not. That email is a big part of why I moved my main tracking to LottoChamp: a tracker only pays off if you actually keep it, and Trey's experience matched what I'd already seen with my own false starts. For anyone who wants a simpler entry point, some coworkers have mentioned Lotto Master Key, which leans toward quick-pick optimization rather than a full dashboard — I haven't run it through the same twenty-week process yet, so I can't vouch for it the way I can for the other two.
Stick With The Tool That Shows Its Work
Neither tool is a magic wand, and nothing here should read as a promise that pattern detection beats the actual odds; it doesn't, and no dataset I've built says otherwise. What twenty weeks of this taught me isn't which platform to buy; it's that you can't judge any lottery tool against your gut, only against a random baseline tracked long enough that one lucky streak doesn't fool you. That's the one rule I'd hand to anyone starting this same experiment.
Money-back terms matter more than marketing copy when you're testing something this uncertain, and LottoChamp's 60-day guarantee is part of why it was the safer platform to commit to for the long haul. If you're curious enough to run your own version of this comparison, LottoChamp is the one still open on my second monitor every Wednesday and Saturday night, and it's the one I'd point a fellow spreadsheet person toward first. Just don't expect it, or anything else in this space, to turn a cheap ticket into a plan.
The information on this site is based on personal experience and research for informational purposes only. It is not a substitute for professional medical, financial, or legal advice. Always consult a qualified professional before making decisions that affect your health or finances.