
Eleven Columns, No Guarantees
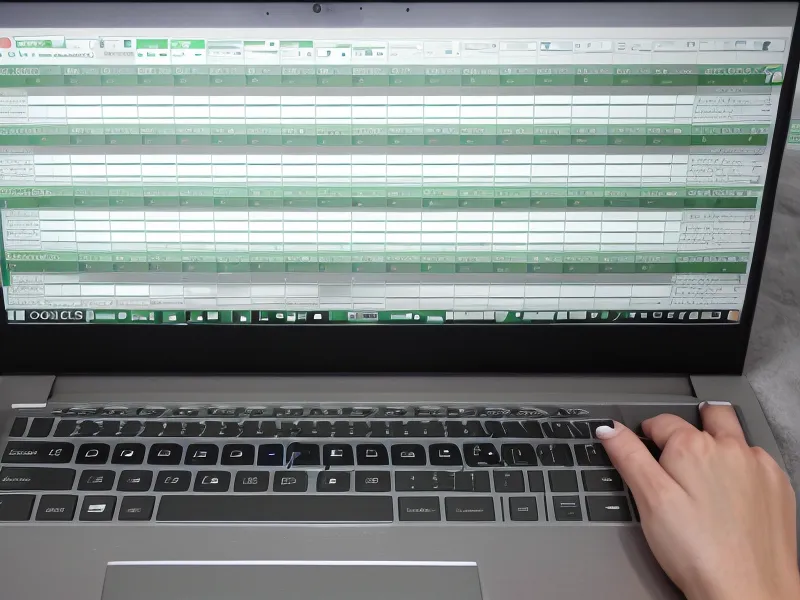
Eleven columns. That's the entire structure of the spreadsheet I use to track every Powerball drawing in Excel, and it's roughly a third of what most "advanced" lottery strategy templates try to cram into one tab. Draw date, five white balls sorted low to high, the Powerball number, Power Play, the numbers I actually played, where those numbers came from, and a column that counts hits automatically. Google Sheets or Excel, it doesn't matter which. What matters is that a tracking spreadsheet gets marketed as a data analysis shortcut — something that will surface a pattern other players are missing — and the more tabs and formulas it has, the more legitimate that promise feels. I've built the loaded version, with frequency counts and gap trackers and color-coded flags. It didn't make my picks any better. Eleven clean columns did more for me than forty messy ones ever did.
Add a dozen more tabs and the promise gets bigger too — pattern recognition, predictive scoring, whatever the marketing copy calls it that week. None of it changes what a Powerball drawing actually is: balls pulled at random with no memory of the drawing before it. The spreadsheet doesn't get smarter by getting more complicated. It gets slower to update, which is usually where people give up on it.
Entering Powerball Data by Hand, on Purpose
Powerball draws Monday, Wednesday, and Saturday nights at 10:59 p.m. Eastern, and every one of those nights I pull the results from the Powerball site by hand instead of scraping them with a script. It takes about three minutes. Some nights I still print the draw history and run a highlighter down the page, the felt tip catching slightly on the paper each time a number repeats, which is a strange kind of quality control, but it works. Manual entry forces me to actually look at the numbers instead of trusting a pipeline I built once and never checked again.
That discipline matters more than any formula in the sheet. Skip two draw nights and the whole log develops gaps that make every downstream number unreliable — the running count, the hit column, all of it. I treat the update like a low-stakes audit: fifteen minutes, same two nights a week, no exceptions.
What More Analysis Tabs Actually Do
Short answer: less than the tabs suggest. I still keep a frequency count, mostly because it's useful context: if an AI platform tells me a number is "hot" or "due," I can check that claim against the actual frequency distribution in my own draw history instead of taking the tool's word for it. What I don't do anymore is treat that count as a forecast. Hot and cold number theory gets a fuller, more honest treatment elsewhere on this site; the short version here is that it belongs in the checking column, not the predicting one.
A friend of mine, Stephen Yoo, keeps a version of this same sheet, weighted completely differently than mine. We met years back at a Charlotte data meetup and discovered we'd both been quietly doing this to numbers that were never going to cooperate. He spends most of his Saturday mornings birdwatching out at Reedy Creek Nature Center, which strikes me as the healthier version of the same instinct: watching closely for patterns in something that's mostly just going to do what it does regardless of who's counting.

Near Misses Are Not the Same as Signal
I was standing at the stove waiting on a pot of pasta water to come up to a boil when one of the platforms I track pinged with a cluster that matched three of the five white balls, two full days before that Saturday's actual drawing. For about ten minutes I forgot I was supposed to be the skeptical one.
That's the moment worth being honest about, because it's exactly the kind of near miss that keeps people renewing a subscription. Run enough clusters across enough weeks and a three-of-five match is closer to expected than impressive; it's the same trap as the Gambler's Fallacy, just wearing a nicer outfit. The near-miss illusion is exactly the kind of thing I catalogued in that rundown of mistakes I made testing AI lottery tools over the last six months, mistaking a partial match for a working method sat near the top of that list.
For a stretch I generated my own weekly picks from a Fibonacci sequence instead, using 1, 2, 3, 5, 8, 13, 21 scaled up to fit the range, half-convinced the ratios meant something the frequency counts didn't. It performed no better than picks I made by closing my eyes and landing a finger on the sheet, which is really the whole point: the method felt more sophisticated than random, and it wasn't.
A commenter named Adanna Ezike, who found this site through a lottery subreddit thread, asked a fair question once: if every draw is independent, why do AI platforms change their "top picks" every single week instead of landing on one answer and sticking with it? It's a reasonable red flag to watch for, and one of the things worth weighing before deciding whether a subscription is earning its keep or just generating fresh noise on a schedule.

What the Sheet Is Really For
Sum totals get the same light treatment in my sheet. Draws cluster into something like a familiar Bell curve rather than spreading evenly across every possible total, so a set that adds up to an extreme outlier gets a second look before I play it. That's a small filter, not a strategy, and I don't pretend it's more than that.
The "source" column ends up doing more work than any of the analysis tabs. It's what lets me separate a Quick Pick from a manual pick from an AI-suggested cluster from a wheeled set, and compare how each one actually performs over time instead of how confident the marketing sounds. It's also where the real cost of playing shows up, unglamorously, line by line; this matters more to me than any predicted combination ever has. None of this carries over to Mega Millions, either; different matrix, different odds, a topic for another write-up.
What a spreadsheet like this can do is give you a clean, honest baseline before you introduce any AI layer on top of it. What it can't do is turn a random drawing into a predictable one, no matter how many tabs you add or how good the color-coding looks. That's ultimately why I keep it going at all: not to forecast the next drawing, but to hold a hit-rate record I can actually check the tools against, the same record behind my six-month journey stress-testing AI lottery predictions.
My wife still thinks the whole thing is excessive. Some nights, watching another set of picks come back with zero hits, I don't have much of an argument against that. But the sheet stays clean, the columns stay honest, and that's a better use of the habit than pretending eleven columns, or forty, will ever tell me what Saturday's numbers are going to be. Play what you can afford to lose, keep the record straight, and treat every prediction claim the way I treat my own: worth checking, never worth trusting outright.
The information on this site is based on personal experience and research for informational purposes only. It is not a substitute for professional medical, financial, or legal advice. Always consult a qualified professional before making decisions that affect your health or finances.