
Late one Wednesday night in the kitchen, I sat with my laptop open, watching the official draw numbers roll in while my master spreadsheet waited for the update. The blue light from my dual monitors felt colder than usual as I realized my 'optimized' AI picks were nowhere near the results. I am a data analyst by trade here in Charlotte, North Carolina, which means I spent my day looking for deviations in consumer behavior. Doing the same for the lottery was supposed to be a weekend hobby, but it turned into a six-month obsession with neural networks and historical draw frequencies.
It started innocently enough with the office Powerball pool. The randomness of it—the way my coworkers just picked birthdays or used the 'Quick Pick' button—drove me crazy. As someone who looks at spreadsheets for 40 hours a week, I couldn't help but wonder if there was a signal hidden in all that noise. I began with basic Excel formulas to track the 69 white balls and 26 red Powerballs, but soon realized I was out of my depth. That is when I fell into the rabbit hole of AI-based lottery analysis tools, platforms that claim to use advanced machine learning to predict the next sequence.
The Six-Month Data Audit
I committed to a rigorous testing phase from late April through mid-autumn 2026. I didn't just play the numbers; I documented them. I selected three different AI platforms, each using a slightly different approach—some focused on 'hot' and 'cold' numbers, while others claimed to use recurrent neural networks to find deep patterns in the Tallahassee-based gravity-fed machines. I treated it like a second job, logging every Monday, Wednesday, and Saturday night draw result against the AI's confidence scores.
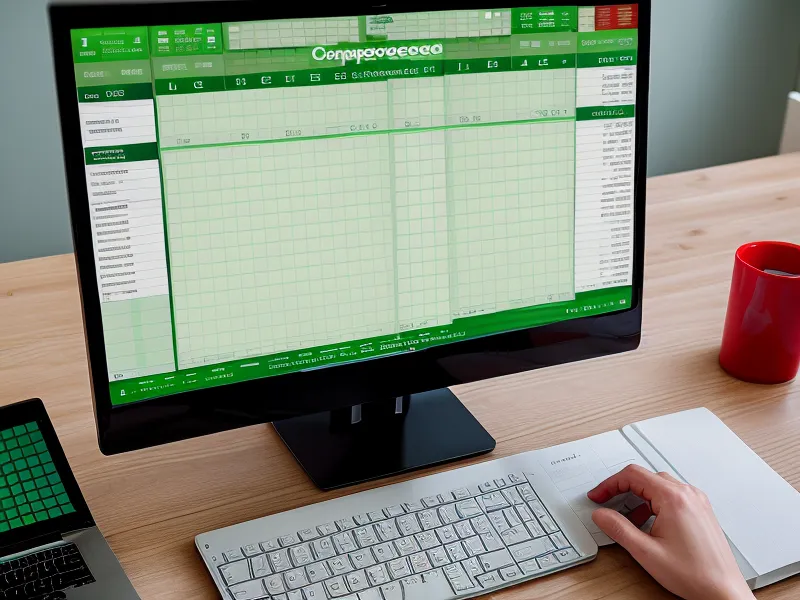
During this period, I tracked every single draw with the same precision I use for my quarterly reports at work. I wasn't looking for a jackpot—the odds of matching all six numbers are a staggering 1 in 292,201,338, and I am a numbers guy, not a dreamer. I was looking for a hit rate higher than random chance. If the AI could consistently predict two or three numbers more often than a random generator, that would be a statistically significant anomaly worth exploring.
My wife, who has watched me color-code everything from our grocery list to our retirement accounts, thinks the master spreadsheet is excessive. She’s probably right. There is a specific rhythmic click of my mechanical keyboard at midnight that has become the only sound in the house as I input the latest Saturday night losers. It’s a dry, lonely sound, but it’s the sound of data collection.
The Mid-Point Realization: Over-Fitting the Past
By mid-July, after about three months of tracking, the data began to reveal a harsh truth. I noticed that the AI tools weren't actually predicting the future; they were over-fitting for the past. In data science, over-fitting happens when a model is so closely aligned with a specific set of historical data that it fails to predict future variations. The AI would show me 'frequency clusters' that looked like insights, but they were actually just the statistical inevitability of small sample sizes.
I’ve written before about how the spreadsheet vs. the machine debate usually ends with the human realizing the machine is just a faster version of their own biases. The platforms were telling me that certain numbers were 'due' because they hadn't appeared in weeks. But the gravity-fed machines at the Florida Lottery studio don't have a memory. Each draw is an independent event. My spreadsheet showed that the 'hot' numbers predicted by the AI hit no more frequently than the 'cold' ones over a 90-day window.
I remember one rainy Wednesday in September where the discrepancy was particularly glaring. The AI had given a 94% confidence score to a sequence that didn't share a single digit with the actual draw. I sat there looking at my 400 rows of conditional formatting, the cells glowing red and green, and realized that I was effectively paying for a very sophisticated version of a coin flip.
The Paradox of High-Frequency Patterns
One of the most interesting things I discovered—and this is where my analyst brain really kicked in—is that optimizing for high-frequency patterns might actually be a bad strategy for the lottery. Most AI tools try to find the numbers that appear most often. However, lottery mechanics and the psychology of shared jackpots suggest a different approach. If you pick the 'most likely' numbers according to an algorithm, you are likely picking the same numbers as thousands of other people using similar tools.
Optimizing for high-frequency patterns actually decreases your expected return because lottery outcomes favor rare, chaotic number combinations to minimize shared jackpots. While the machines themselves are physical and subject to gravity, the distribution of winning tickets is a game of human psychology. If you actually win with a 'popular' AI-generated sequence, you're splitting that prize with so many people that the value of the win plummets. The data taught me that the real 'win' in analysis isn't predicting the numbers, but avoiding the patterns that everyone else is chasing.
I should probably mention that I am not a mathematician or a gambling advisor. I am just a guy in Charlotte who likes to see if the math holds up to the marketing. I have zero insider information, and as I tell my coworkers when they ask for my 'picks' over lunch, the lottery is a form of entertainment with a negative expected value. You should never spend money you can't afford to lose, and if you feel like you're losing control, you should absolutely talk to a professional counselor. This spreadsheet is a hobby, not a retirement plan.
Documenting the Chaos
Despite the lack of a 'magic formula,' I haven't stopped updating the spreadsheet. There is a certain peace in knowing exactly how random the world really is. I’ve documented my process in my Charlotte spreadsheet: testing AI pattern detection across six months of Powerball draws, and the conclusion remains consistent: the tools are better at organizing history than forecasting it.

The most telling moment of the whole experiment wasn't a winning ticket. It was a Tuesday evening when I had both monitors flickering with probability density functions and scatter plots. My wife glanced at my dual-monitor setup with 400 rows of conditional formatting and slowly closed the office door without saying a word. She didn't need to say anything; the data on the screen was a testament to the absurdity of the project. I was trying to find logic in a system designed specifically to be illogical.
If you're going to use these AI tools, use them for what they are: sophisticated data visualization. They can help you see the history of the game in ways a simple list of numbers can't. They can help you ensure your picks are sufficiently 'chaotic' to avoid sharing a prize. But they can't change the physics of a ball dropping through a tube. As I sit here on this mid-October night, about to input the results from another draw, I've come to enjoy the spreadsheet for the story it tells—a story of how humans are hardwired to find meaning in the void, even when the void is just 69 white balls bouncing in a plastic drum.
The information on this site is based on personal experience and research for informational purposes only. It is not a substitute for professional medical, financial, or legal advice. Always consult a qualified professional before making decisions that affect your health or finances.