
An AI tool promising a high-confidence pattern match might be nothing more than a hot-and-cold number tracker with a better dashboard. This question sits underneath every predictive software pitch in the AI lottery analysis space, and it's the one I set out to answer with six months of Powerball tracking and more data modeling than my wife thinks is reasonable for a hobby.
The short answer: it doesn't hold up. Across roughly 60 draws logged against three different platforms, my tracked hit rate landed almost exactly where the published odds said it should, and the marketing language never quite matched what the numbers were doing underneath it. The long version explains why these tools still feel convincing even when they aren't doing what the sales page claims.
AI Lottery Predictions Rest on One Big Myth
These platforms lean hard on their Long Short-Term Memory (LSTM) networks, marketing copy that promises the software can spot structure most people would miss in what looks like plain noise. The pitch sounds reasonable if you don't stop to ask what the model is actually being fed.
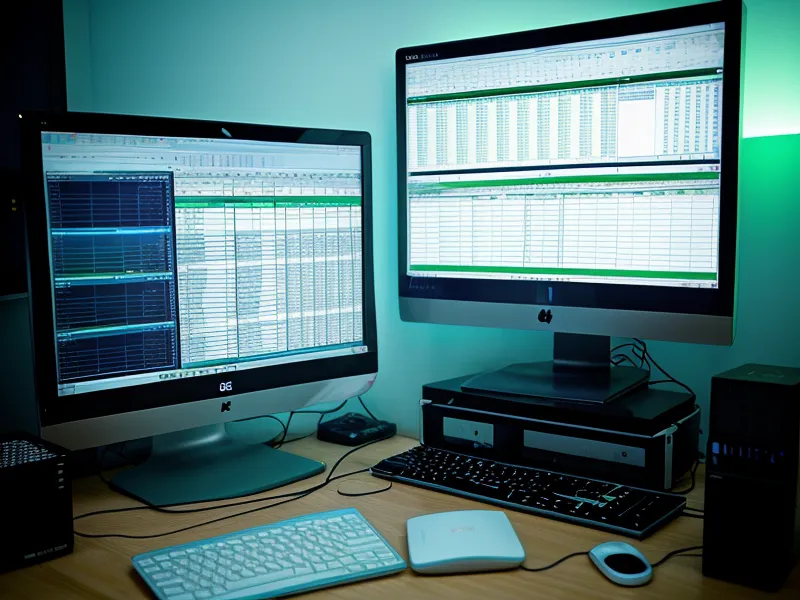
My audit setup was straightforward: three AI lottery analysis platforms, the standard $2 ticket cost per play, and every suggested pick logged against the actual Wednesday and Saturday draws. I wasn't chasing a jackpot; I wanted to see whether any platform could edge out a plain random walk through the number field, not just land a lucky hit now and then, or at least beat the baseline odds of 1 in 24.87 for any prize. I've written about the mechanics of that tracking setup before in the spreadsheet that annoyed my wife, and the short version is that small sample sizes are still the biggest trap in this hobby.
Before any of the AI platforms, I tried the analog version of the same idea: a lottery prediction guide I bought off Amazon, the kind with a glowing five-star average and a confident title. It gave me nothing my own frequency chart couldn't produce for free, and I felt a little foolish for paying for it. That disappointment turned out to be a preview of what the fancier software would eventually show me too, just wrapped in a nicer dashboard.
So What Is the Data Modeling Actually Doing?

Powerball draws are independent events, whatever came up last Wednesday has zero bearing on tonight's draw. A tool that claims to track "momentum" across draws is really doing a fast version of overfitting: building a model that explains the past draws perfectly while telling you nothing useful about the next one. What I found underneath the branding was closer to the hot-cold number theory casual players have argued about for years, heavily weighting numbers that had shown up in the last ten draws and running the count faster than a person could by hand.
None of the three platforms I tracked beat the baseline odds by a margin that held up once I ran a proper backtest against a random draw comparison. The early streaks that looked promising flattened out as the sample grew, which is usually how these things go once you stop looking at a single lucky week and start looking at the whole set.
The Backfitting Problem
One platform had a habit of updating its "success" summary after the draw already happened, framing a suggested 14 against an actual 15 as a near miss. In data analysis, a near miss is just a miss; there's no partial credit for being adjacent to a random draw. When a high-confidence pick didn't hit, the dashboard would pivot the next morning to a "secondary pattern" that happened to line up instead. Run enough patterns and one of them matches by coincidence eventually. That's not intelligence, that's volume.
Kelsey Tatum, who I know from a Charlotte data meetup, emailed me after seeing one of these comparisons and asked how confident I really was in 60 draws as a sample size. It's a fair question, and one she tends to push harder than most people who read these writeups. The honest answer is: not fully. Sixty draws narrows the noise but it doesn't erase it, and I say as much every time someone asks.
My wife caught me taping a comparison sheet to the fridge a few weeks back, mostly so I'd stop leaving it on the kitchen table, and she actually stood there and read the whole thing before heading out the door. She didn't say much, but the fact that she stopped scrolling past it felt like more of an endorsement than any five-star rating on an app store ever gave me.
A friend of mine spends most evenings following stock picks on Reddit day-trading forums, hunting for the same kind of edge in market charts that I'm hunting for in Powerball draws. Neither of us has found it. He'll tell you a stock "feels ready to break out" the same way an AI lottery tool tells you a number cluster is "high confidence" -- it's a story built after the fact, not a prediction that held up before it.
Judge the Confidence Score, Not the Hype
If you're going to use one of these predictive software platforms, the rule I've settled on is simple: track its hit rate against the plain published odds for a full season of draws before you trust a single "high-confidence" pick. Ignore any dashboard that reclassifies a miss as a near miss after the fact, and be skeptical of any tool that won't show you its raw hit rate next to the baseline odds. That's the whole test. Anything fancier than that is marketing dressed up as math.
The tool-by-tool numbers didn't make it into this summary, but they're broken out in my LottoChamp Review: Is This AI Tool Better for Tracking Frequencies? and in Beyond the Random: My Six-Month Deep Dive into AI Lottery Prediction Tools, if the aggregate hit rate above isn't specific enough for you.
Powerball Tracking Still Lands on the Published Odds
Closing the spreadsheet most nights, I still open it again the next morning, mostly out of habit at this point. The AI tools didn't break the game and they didn't need to; they gave me a faster way to sort the noise, which is a different thing entirely from predicting it. Some evenings I shut it all down and drive out to Lake Norman just to look at something that isn't a spreadsheet cell for an hour. The numbers will still drop Monday, Wednesday, and Saturday whether I'm there to log them or not, and my hit rate will keep landing right around where the odds say it should.
The information on this site is based on personal experience and research for informational purposes only. It is not a substitute for professional medical, financial, or legal advice. Always consult a qualified professional before making decisions that affect your health or finances.