
Late one Wednesday night in Charlotte, the blue light of my dual monitors was the only thing illuminating the kitchen as the Powerball drawing numbers flickered onto the screen, mocking my manual spreadsheet. I was sitting there, nursing a lukewarm coffee, watching the balls roll out while my VLOOKUP formulas sat idle. It was one of those moments where you realize your hobby has officially mutated into something else.
Before we get into the weeds of my data, a quick heads-up: I use affiliate links on this site. If you decide to try one of these tools through my links, I earn a commission at no extra cost to you. I only talk about tools I’ve personally plugged into my master spreadsheet. Full transparency: I’m a data analyst, not a professional gambler or a mathematician. This is for entertainment, and the house almost always wins. Talk to a financial professional if you’re struggling with spending.
The Late-Night Charlotte Kitchen Experiment
It started innocently enough with an office pool at my firm. We’d all chip in a few bucks when the jackpot hit some astronomical number, and I was the guy tasked with keeping the spreadsheet. But the randomness of it bothered me. As someone who spends forty hours a week looking for efficiency in corporate datasets, the idea of pure, unadulterated chaos felt like a personal insult. I started tracking the Powerball white ball range (1 to 69) and the red ball range (1 to 26) on my own time.
By early spring, I realized my manual entry was failing. I’d spend hours troubleshooting a VLOOKUP error in my master sheet only to realize I had accidentally deleted the previous Wednesday's winning numbers. It was frustrating. I needed a more robust way to handle historical data without losing my mind. That’s when I fell down the rabbit hole of AI-based lottery analysis tools. I wanted to see if machine learning could handle the frequency tracking better than my clunky Excel macros.
Moving Beyond the Office Pool Spreadsheet
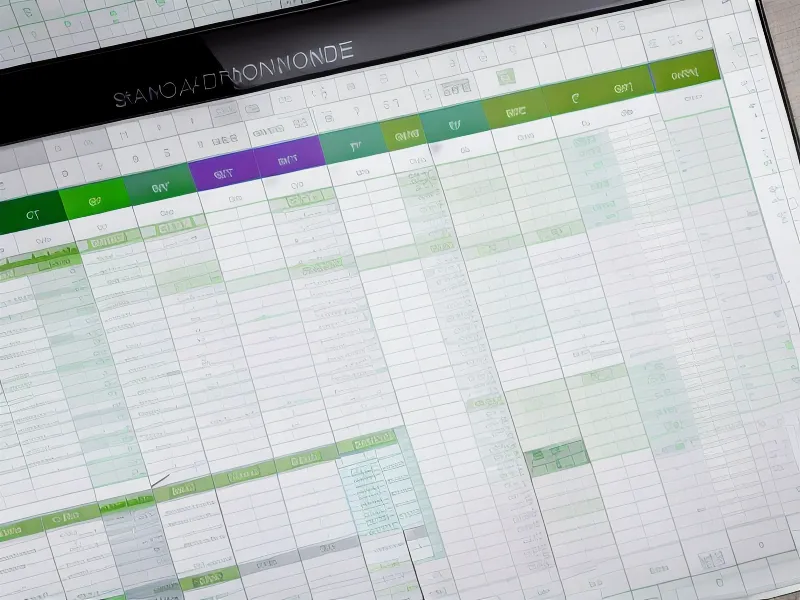
I didn’t just jump in blindly. I’m a numbers guy, so I treated it like a software audit. I set up a 48-column spreadsheet to track the suggestions from three different platforms against the actual draws every Wednesday and Saturday night. Several weeks after the initial setup, the project had taken over my home office. My wife walked into the office one evening, saw the massive grid of numbers on my vertical monitor, and slowly closed the door without saying a single word. She’s probably right—it’s excessive. But once you start seeing the 'hot' and 'cold' frequencies visualized, it’s hard to look away.
The transition from my homegrown system to something more professional led me to LottoChamp. What caught my eye wasn't the marketing fluff, but the fact that it offered a 60-day guarantee period. As a data analyst, I appreciate a trial window that actually covers enough draws to be statistically interesting. Over two months, you get roughly 17 or 18 Powerball draws, which is just enough to see if the tool’s database updates are as consistent as they claim.
Testing the Machines: LottoChamp and the Frequency Database
About three months into the project, I noticed a shift in my approach. I stopped looking for 'the winning numbers'—because, let's be real, nobody can predict a random draw with 100% certainty—and started looking for frequency clusters. LottoChamp’s interface looks like it was designed in the early 2000s, but the database updates happen every Wednesday and Saturday night like clockwork. That’s what matters when you’re trying to keep a master spreadsheet current.
I spent a rainy Saturday in August comparing the hit rates of 'high-probability' picks. I remember the specific low-frequency hum of my laptop fan as it processed six months of historical draw data at 2 AM. I wasn't looking for a jackpot; I was looking for small wins. Most AI tools, including Lottery Defeated, focus on narrowing the field of 69 white balls down to a more manageable pool based on historical patterns. I’ve documented this process in my notes on The Spreadsheet vs. The Algorithm: Tracking AI Lottery Predictions Over Six Months.
The Reality Check: Patterns vs. Paychecks
There’s a specific angle to this hobby that most 'lottery gurus' ignore. Most AI strategies assume you have the disposable income to play high-volume sets. They might suggest 20 or 30 combinations to cover the most frequent patterns. But for a lot of people, especially those living paycheck-to-paycheck, that’s just not realistic. If a standard Powerball ticket is $2, a 'high-volume' strategy can easily eat a week's grocery budget before the first ball even drops.
I’ve had to adjust my tracking to account for this. Instead of following every suggestion, I use the tools to filter my own picks. It’s about narrowing the odds, not buying the win. I’ve even looked at more budget-friendly options like Lotto Master Key, which seems to have a conversion rate of about 1.66% among users looking for a simpler system. It doesn’t have the massive database of LottoChamp, but it’s less overwhelming for someone who isn't trying to build a 48-column monster in Excel.

When the Numbers Actually Line Up (Briefly)
I won’t lie and say it’s all just dry data entry. There was a Saturday night a few weeks ago where I felt the slight jolt of adrenaline in my chest when the AI's 'high-probability' picks matched the first three numbers of a live draw. My heart rate spiked for a second before the fourth ball went a completely different direction. That’s the hook, isn’t it? The moment where the pattern seems to hold.
But the data usually brings me back to earth. My hit rate for three numbers is significantly higher than it was when I was just picking birthdays and anniversaries, but it’s still a game of extreme variance. If you want to see the specific breakdown of those frequencies, you can check out my analysis on LottoChamp Review: Is This AI Tool Better for Tracking Frequencies?. I’ve found that the AI is better at identifying 'cold' numbers—the ones that haven't appeared in 20+ draws—than it is at picking the next 'hot' one.
Final Tally: Is the Spreadsheet Excessive?
As we move from late summer into autumn, my master spreadsheet is still growing. My wife still thinks it's a waste of time, and she’s probably right from a strictly financial ROI perspective. But for me, it’s about the process. Using AI to filter historical frequencies has made the hobby feel less like a blind gamble and more like an analysis project. It's about finding order in the 1 to 69 chaos.
If you're tired of the purely random approach and want to see how these tools handle the data, I’d suggest starting with something that has a solid database like LottoChamp. Just remember to keep your expectations grounded in reality. The lottery is a negative expected value game, and no amount of AI can change the fundamental physics of a plastic ball in a wind machine. Play for the data, play for the fun, but don't play with money you need for rent.
If you're ready to move beyond manual entry, take a look at the tools I've been auditing. They might not make you a millionaire overnight, but they'll certainly give you a better set of numbers to track than just picking at random.
The information on this site is based on personal experience and research for informational purposes only. It is not a substitute for professional medical, financial, or legal advice. Always consult a qualified professional before making decisions that affect your health or finances.